You’ve planned and published your social media post, and now it’s out there in the digital world. But, the work doesn’t stop there. It’s important to analyse the performance of your social media posts and page, so you can understand what’s working, and what’s not.
Reporting on social media might seem overwhelming at first, but once you’ve chosen your key metrics, and have the right tools in place, reporting will become a breeze.
We’re taking a deep dive into everything you need to know about social media reporting for restaurants. Here’s a lowdown on the topics we’ll be covering:
- How to choose which metrics to measure
- How to analyse your restaurant’s social media performance
- The different tools for analysing your restaurant’s social media performance
- The different social media reports to create
From social media trends and technology to traditional tricks that haven’t lost their magic, get the lowdown on how to market your restaurant with our free guide.The ultimate guide to restaurant marketing
How to choose which metrics to measure
When you’re first getting started on social media reporting, it can be confusing to work out which numbers are worth analysing, and which are vanity metrics. We often refer to follower and like count as vanity metrics – while they’re great to have, they don’t give you true insight into return on investment in comparison to referral traffic and conversions.
Below are six metrics that you’ll see and hear in reference to social media reporting.
Engagement
Engagement does what it says on the tin. This metric refers to how many people have engaged with your post, be it through likes, comments, saves, or shares. The engagement metric shows how engaged users are with your content, and also tells you how they interact with your content.
If your aim is to create share-worthy content, looking at how many shares is a valuable metric to analyse. If, on the other hand, you want to encourage a conversation, looking at how many comments a post receives is useful.
Impressions
Impressions are the number of times your content is displayed on a social media platform. Impressions relate to content that a social media user is shown, no matter if they clicked on, or interacted with, the post. Impressions are typically higher than reach, as reach counts users that interacted with a post.
Impressions are a useful metric to measure for paid content, as it shows you how many people have seen your promoted content.
Reach
Reach and impressions have many similarities. They both relate to how many people see your posts, however, reach focuses on social media users that interacted with a post.
Reach is a useful metric to consider if your focus is on brand awareness, as it tells you how many people are not only seeing your content, but engaging with it.
Referral traffic
Referral traffic is a social media metric that will tell you how much traffic your restaurant’s website is receiving from your social media platform. This metric is incredibly important if your aim is to get customers to visit your website.
If a social media user clicks through to your website from your social media post, it shows that they have a strong intent, be it to book a table, or gain a greater understanding of your brand.
Referral traffic is a great indicator of what content viewers find most interesting to interact with. You can use this as a way to identify trends as well as types of content (e.g., reviews, blog posts, social media mentions) that are most effective at driving traffic, to guide future marketing efforts through your social media.
There are many ways to encourage referral traffic, including a clear CTA in your caption, and adding a direct link that social media users can click on. On Instagram, be sure to update your link in bio to the most relevant link, or use a third-party platform such as Linktree, to direct users to multiple links.
To encourage more traffic to your website, it’s essential to keep it updated with the latest menus, opening hours, and important customer updates. If a visitor wants to learn more about your restaurant, the site’s usability and information should be easy and straightforward to navigate.
Conversions
Conversions are a key social media metric to consider if you’re running paid ads as they will show you whether you have a good ROI (return on investment).
From an organic perspective, the exact conversion metric will differ between brands. For one restaurant, conversion might mean a booking to your restaurant, or a sign-up to your newsletter, or even a purchase from your restaurant’s website.
Once you’ve defined your conversion metric, you can see how many social media users converted.
To get a clear understanding of your conversion rate, it’s wise to use UTM links. A UTM link is a URL with a specific UTM code attached to it. This lets you track each click, and where it comes from. An example of a UTM link would be:
- Source: Your restaurant’s booking URL
- Medium: Instagram
- Campaign: Summer promotion
Using this specific link lets you see how many people booked a table from Instagram, based around a summer promotion campaign you were running.
Using UTM links provides comprehensive data on user behaviour. This includes insights into which social media content is most engaging and which types of posts are most effective in driving website visits to your restaurant.
Audience growth
As we mentioned earlier, follower count is often considered a vanity metric. But, it’s worth keeping an eye on your audience growth to gauge whether you’re growing month on month, or losing followers. It’s normal for your follower count to fluctuate, but if you’re consistently losing followers, it might be an indication that your content isn’t interesting to your followers.
By checking in on your audience growth, or lack thereof, it’ll help you define your content strategy. That might mean prioritising videos, sharing more behind the scenes content, or publishing user-generated content rather than stylised photography.
Learn more: Restaurant Social Media Marketing Tips
How to analyse your restaurant’s social media performance
Now we’ve established the key social media metrics to consider, let’s look at how you can analyse your restaurant’s social media performance.
Decide on your goals
This first step should really begin before you even create your content. Ask yourself, what is my goal, and how will I achieve it with this post? Once you’ve got your goals in mind (re-read the above section if you need help deciding your goals), you can analyse your social media post to see if they achieved them.
Choose how often you want to report
The chances are, reporting on your restaurant’s social media performance isn’t something you have a lot of time to dedicate to. That’s why it’s useful to set up a recurring time to spend on this task.
We recommend choosing to analyse on a weekly or monthly basis. This time frame also lets you compare your performance week on week, or month on month, to get a broader understanding of how your restaurant’s social media is performing.
Delve into the data
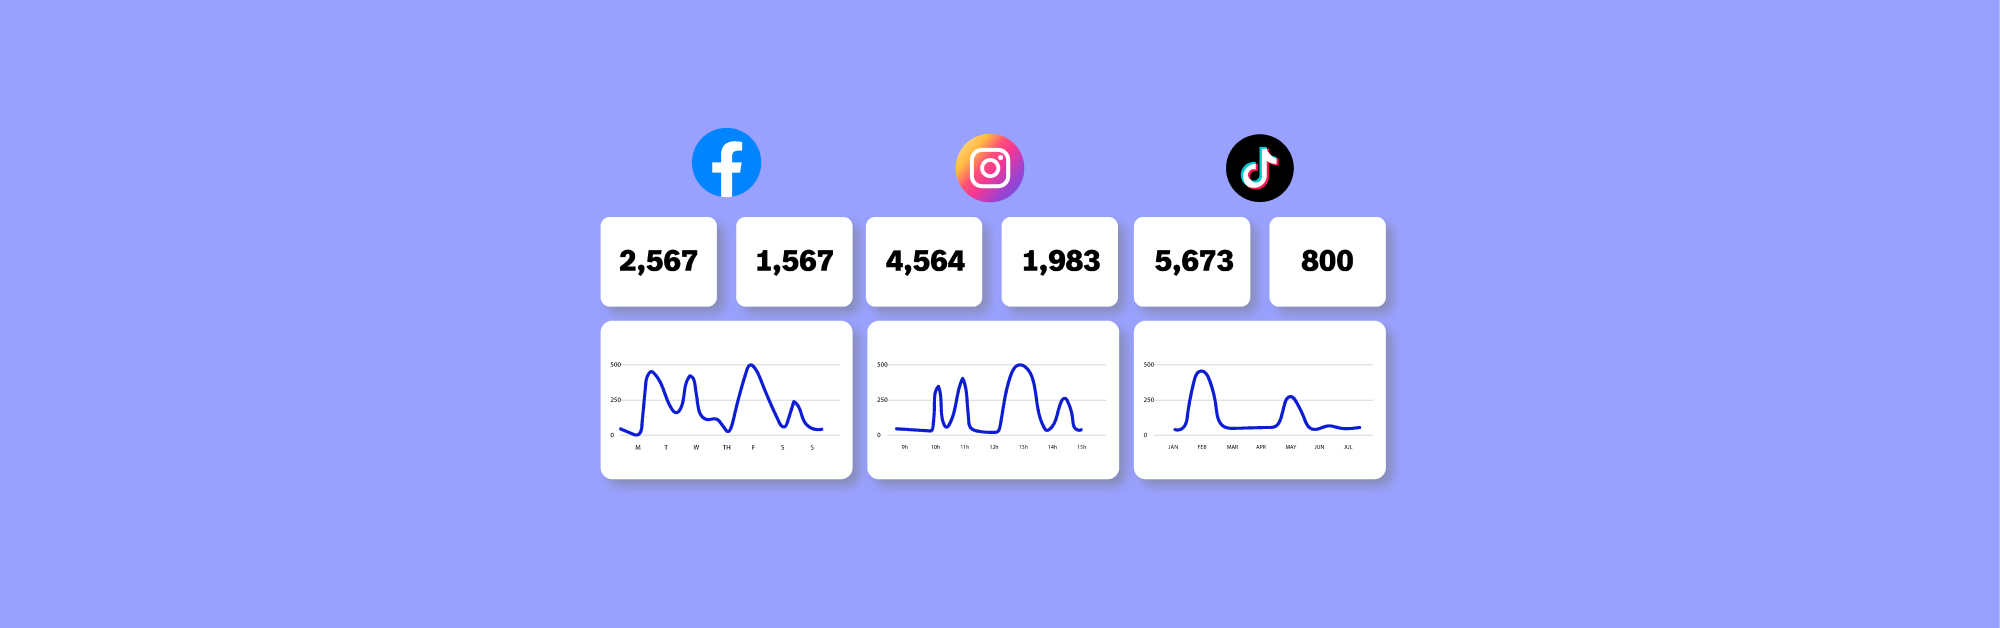
Now here’s the fun part – delving into the data. The joy of social media is that as well as being an incredibly creative place, the platforms are very data-driven, and often, the data is clearly laid out for you.
We’re covering this in more detail in the section below, but you can use the platforms themselves (Facebook, TikTok, Instagram) to analyse your performance, or use a social media management tool such as Sprout, or Hootsuite.
Analyse your results
You’ve got the data in front of you, so let the analysis begin. Start by looking at each individual post, and your page in general, and take note of the highlights and the lowlights. Which post performed best based on your goals? Which post flopped in comparison to your goals? How did your overall social media performance compare to last week, or last month? Are there specific posts or campaigns that lead to higher website traffic?
Analysing your results lets you make better, data-based decisions on future social media posts (more on this below), saving you wasting time on posts that may not be engaging to your followers. It also gives you a better understanding of what your followers want to see, and what they engage with.
Make data-led decisions
Without any analysis of your restaurant’s social media performance, you can’t make any data-led, strategic decisions. But, once you have that data available to you, you can craft social posts based on the facts.
Are your top performing posts videos that show dishes being made? Consider how you can make these a key part of your social media strategy going forward. Are the posts that get the most comments photos that users have taken (otherwise known as UGC)? Consider how you can encourage customers to share more images taken in, or of, your restaurant.
While the data is important, remember to test new ideas and see what other restaurants are doing, and of course have fun with it, too-it’ll show in the content you choose to share.
Lightspeed is the unified ePOS and Payments platform powering ambitious entrepreneurs in over 100 countries.See Lightspeed in action
The different tools for analysing your restaurant’s social media performance
Social media platforms make analysis easy by giving you the numbers you need in a clear, digestible format. Below are different ways to analyse your social media performance, either within the platforms themselves, or by using a social media management system.
1. Meta Business Suite
Within the Meta Business Suite, there’s an insights tab. This gives you an overview of how your Facebook page has performed. There’s a clear overview section, as well as deep dives into results, audience, benchmarking, and plenty more.
You can choose the time period you want to review, and from there, you can see a wealth of information, including a breakdown of your audience, their gender, age, and location. The content tab lets you see the performance of each individual post.
Another section of the Meta Business Suite that’s worth delving into is benchmarking. Within this section, you can compare the performance of your business and content with similar businesses. By doing this analysis, you can understand how you’re performing against your competitors. It’s an excellent way to see what is and what isn’t working for your business, while also identifying trends that other restaurants and competitors are already sharing.
2. Instagram Insights
Once you’ve delved into your world of in-app analytics on Instagram, you won’t want to leave. Within the app, navigate to the ‘insights’ dashboard. From there, you’re able to see the following information:
- Accounts reached
- Location, age range and gender of reached audience
- Profile visits
- External link taps
- Email button taps
- Accounts engaged
- Likes
- Saves
- Comments
- Total followers
- The time your followers are most active
These sections clearly align with the key metrics you want to analyse, making it easy to see your results.
While some insights such as ‘time your followers are most active’ might not address a specific metric, they can still help you make informed decisions on when to post. So, if you see that your followers are online most frequently on a Friday, aim to post your content at the same time, and analyse if there’s been an increase in engagement after a couple of weeks.
3. TikTok Analytics
Similar to Instagram, on TikTok, you can view your analytics within the app. The analytics are split into three sections: overview, content, and followers.
The content tab is where you’ll find the most in-depth information including total views, total likes, comments, shares, average watch time, watched full video, traffic source type, and audience location.
One of the limitations of using in-app analytics for TikTok is the time period you can see. To review specific content, you can only see the last 7 days, while in the general overview, you can see the past 60 days.
4. Google Analytics
Google Analytics is a powerful tool that can analyse everything from user behaviour trends to real-time geographic data. However, for restaurants focusing on social media reporting, its most valuable feature is traffic tracking and analysis.
Google analytics helps you track traffic from various social media platforms, letting you see which ones drive the most visitors to your actual website-where the magic happens. This way, you can prioritise your efforts on the platforms that matter most, saving you time and maximising your impact.
5. A social media management platform
A social media management platform such as Sprout gives you more insights than you’re able to get from TikTok and Instagram insights. These platforms are a good investment if you’re looking to take your social media to the next level, or need to provide reports to stakeholders within the business.
Within social media management platforms, you’re able to view insights for a longer period of time, and you’re also able to make week on week, month on month, and year on year comparisons. These platforms also let you see the performance of your competitors’ social media, and analyse your social media based on individual posts, profiles, pages, and on how you’ve tagged your content.
Using tags is helpful if you’re a multi-location restaurant. If you have one social media profile for your brand, but share content from different restaurant locations, you can tag each post with the name of the restaurant that the post features. That way, you can analyse how the content performs based on which restaurant you’re talking about.
Tags are also useful when you’re running campaigns, such as seasonal promotions, new menus, or one-off events. By tagging each post within these campaigns, it makes it easier to go back and analyse the performance of the entire campaign from a social media perspective.
As well as using social media management platforms to analyse your content, you can use them to schedule content.
The different social media reports to create
If you’re reporting on your restaurant’s social media performance to stakeholders, it’s a good idea to create easy-to-read reports. These can include a broad overview of performance, best and worst performing posts, and next steps.
Using a social media management platform is the easiest way to create reports, as they’re pre-built – you decide the data you want to include, and the report is built for you.
It’s a great idea to create a campaign report for bigger events, such as special promotions and new menu launches. These reports can then help you plan and execute future campaigns, based on the results you receive.
Competitor reports are useful if you’re looking to take your social media in a different direction, or to see things you could be doing differently. While every restaurant is different, and it’s important that your restaurant has its own voice and look at social media, it can be helpful to see what sort of content performs best for your competitors – maybe it’s reels, maybe it’s carousel posts, or maybe it’s standalone images.
Ready to take your restaurant to new heights?
Social media as a form of marketing can help take your restaurant to the next level. You know what else can? An all-in-one ePOS designed to help you manage, optimise, and scale your business with ease. Take a look at Lightspeed Restaurant right here.
News you care about. Tips you can use.
Everything your business needs to grow, delivered straight to your inbox.