
Whether you run a brick-and-mortar shop, an eCommerce site or both, getting a grip on how your retail business is performing is key to pulling through.
When it comes to performance, numbers don’t lie. Are you at a loss with what’s happening in your business? One of the first things you should do is look at your retail metrics and KPIs (key performing indicators).
Luckily, a whole range of retail KPIs exist for you to track performance on everything from sales, to customer retention and inventory.
In this post, you’ll find some useful retail KPIs to better inform your business decisions.
We’ll explore:
1. Conversion rate
2. Sales per square foot
3. Sales per employee
4. Average transaction value
5. Basket size / items per transaction
6. Online sales relative to brick-and-mortar locations
7. Year on year growth
8. Gross profit
9. Net profit
10. Sell through rate
11. Inventory turnover
12. GMROI
13. Inventory shrinkage
14. Foot traffic
15. Customer retention rate
How to use retail KPIs
Generally speaking, KPIs are used to determine whether or not you’re meeting your goals.
They’re called key performance indicators for a reason: they help you gauge your performance, so you can decide on the right course of action.
Depending on what you’re measuring, KPIs help you see where you’re at in terms of sales, inventory movement, growth, customer satisfaction etc. In the points below, we’ll dive into the specific KPIs you should be looking at how to use them.
Note: In the following paragraphs, you’ll see a quick description of each retail metric and the formula to calculate it. And while we think this is a great starting point to understanding what to track in your retail biz, we’d be remiss if we didn’t mention retail analytics and reporting.
You should certainly know how to calculate various metrics and KPIs, but in real-world applications (particularly if you’re running a fully-fledged retail business), it’s best to use a retail software solution that crunches the numbers for you. Doing so will save you time and help you gain the insights you need much faster.
With that said, let’s dive into the metrics!
Sales metrics and KPIs
Sales are the lifeblood of any retail business, so it’s critical that you keep a close eye on them. Consider the following KPIs:
1. Conversion rate
Conversion rate is an essential KPI for retail, either online or in store. By indicating what proportion of customers who visit your store actually buy something, you get a bigger story than you would through transactions alone.
How to calculate conversion rate
To calculate conversion rate, you first have to determine a time period you’d like to measure. Say you changed your store layout a month ago in a bid to optimise sales. In the space of that month, eight hundred people entered your shop.
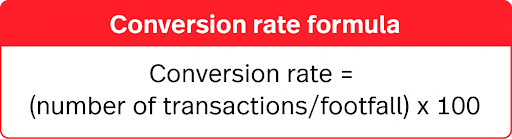
You consult your retail pos system and find that you processed six hundred and forty transactions in the same time period. To get the conversion rate, simply divide the number of transactions by foot traffic.
Conversion rate = (640/800) x 100
Conversion rate = 80%
Calculating conversion rate online
Calculating conversion rate for your webshop is slightly different. Since you don’t have any customers physically walking into your store, the equivalent metric would be website traffic: how many people have visited your website in total.
Let’s say you updated your website design 3 months ago to get more traffic. You’d like to gauge the effect the redesign had on conversion. Your webshop had 12,000 visitors in that time period, and 2,000 conversions.
Conversion rate = (2000/12000) x 100
Conversion rate = 10%
Why measure your retail conversion rate?
Your conversion rate tells you how good you are at turning lookers into buyers. Driving store visits is great, but traffic alone won’t add much to your bottom line if your visitors don’t convert.
In store, conversion rate can tell you about the effectiveness of your visual merchandising and customer service in motivating customers to buy.
Online, it tells you how well you’re nurturing customers at different points in the sales funnel, as well as measure the ROI of your ad spend and email marketing.
How do you improve your conversion rate?
In store, increasing your conversion rate starts with your employees. Be sure to train and empower your associates to:
- Build rapport with customers
- Become “likable experts” who can provide product information and insights
- Be convincing without being pushy
Online, growing your conversion rate has more to do with how visitors experience your webshop. Consider the steps users need to take to make a purchase. What can you do to reduce friction and lead them to purchase?
- Optimise your web design to increase the chances of conversion
- Capture customer data like their email address so you target them with email marketing
- Optimise your on-page SEO to ensure visitors find what they looking for
2. Sales per square foot
Sales per square foot captures how efficiently you make use of available space in your bricks-and-mortar retail store.
It varies according to the size of both your retail space and that of the products you’re selling. For that reason, there’s no such thing as an ‘ideal’ sales per square foot.
Historically, the higher your sales per square foot the better. But as omnichannel retail continues to take centre stage, sales per square foot is becoming less indicative of a businesses success since it only measures sales made in a bricks-and-mortar location, not online. Stay ahead of trends and future-proof your business.
Run your retail store smarter
However, for businesses that use their bricks-and-mortar location as experiential retail spaces or promotional devices—physical spaces where customers can interact with your products—sales per square foot is still a relevant metric.
How to calculate sales per square foot
The formula for calculating sales per square foot is fairly simple. You’ll first need to select a time frame you’d like to measure and get the total value of sales revenue during that period.
Let’s say you’d like to measure your sales per square foot over the holiday period in your 500 square foot shop. This data should be readily available in your retail ePOS system.
The cash value of your total sales revenue for the holiday period is £700,000. Divide that number by your total retail space by square foot.
Sales per Square Foot = £700,000/500
Sales per Square Foot = £14,00
Why measure your sales per square foot?
Retail sales per square foot is a good indicator of store productivity, and it can also tell you if you’re making good use of space and fixtures in your shop. You can use this metric when planning your store layout and merchandise.
Certain stores and industries make their sales per square foot public, which means knowing this metric will help you determine how your business compares with others. Here’s a look at the average sales per square footage in different retail sectors:
- Apparel – $336
- Specialty retail – $325
- Grocery – $510
How do you improve your sales per square foot?
The right sales and retail productivity tactics will depend on your store, but here some general tips for improving your sales per square footage:
- Improve your store layout
- Have a winning product assortment
- Optimize your prices or promotions
- Increase transaction or basket value
- Train your staff to sell more
- Encourage people to stay longer in your shop
3. Sales per employee
Sales per employee helps measure staff performance over time, making staffing more efficient and allowing retailers to fully utilise their most skilled and experienced staff.
High sales per employee shows that your business is able to sell more with less staff, therefore keeping your overhead costs low and profit margins high.
How to calculate sales per employee
Let’s say your sales revenue from the last two years was £3,600,000. During those two years, you employed a total of 14 staff.

Again, the formula for calculating your sales per employee is fairly straightforward. Divide your sales revenue over the specific time period by the number of employees during that period.
Sales per employee = £3,600,000/65
Sales per employee = £55,384.50
Why measure retail sales per employee?
This metric can help you make smarter employment decisions, particularly when it comes to hiring, scheduling, and compensation.
If you want to get more profound insights into your revenue and staffing, go beyond the formula above and measure the revenue generated by individual employees.
The easiest way to do this is through your point of sale system. Find a POS solution that tracks sales per employee, and use that data to come up with sales targets and determine who best associates are.
How do you improve your sales per employee?
The best way to improve on this metric is to get your associates to generate more sales. Depending on your store, this may include actions like:
- Setting smart sales goals per employee
- Investing in sales training
- Motivating your staff to perform better
- Running friendly competitions to gamify that sales process
- Giving staff members the tools (like a good CRM) to make it easier to generate sales.
4. Average transaction value
If you’re pumping money into marketing campaigns or promotions to boost sales, a hike in Average Transaction Value measures the success of those efforts in terms of ROI.
It shows retailers how much, on average, customers are spending with each purchase.
How to calculate average transaction value
To get your average transaction value, calculate the total value of your transaction within a designated time period, then divide that by the total number of transactions during the same period.
So let’s say for the last 6 months, the total value of transactions came to £800,000, with a total number of 3840.
ATV = £800,000/3840
ATV = £208
Why measure your average transaction value?
Like we said, this metric gives you a general idea of how much people are spending. A high dollar amount could mean that shoppers are purchasing your more expensive products or they’re buying larger quantities.
You could derive some insights and action steps from this KPI. For instance, having a low average dollar per transaction could indicate that you need to rethink your pricing. Or, it could mean that you have to implement new sales tactics such as upsells, bundles, or other offers to get shoppers to spend more.
How to increase your average order value
Look into upselling or cross-selling. Done right, both tactics enable you to increase sales while helping customers at the same time.
The key to upselling or cross-selling success is doing it correctly and at the right time and place. If you upsell a product that’s irrelevant or if you’re selling in such a way that you’re coming off as pushy, then you’ll not only fail to convert the customer, but you might even lose the original sale.
The #1 rule here is to always provide value. Yes, getting someone to upgrade their purchase or to buy an additional item will benefit you, but the deal must also be advantageous to the customer.
5. Basket size / items per transaction
Basket size measures the number of units sold per transaction. It is calculated using the following equation.
Basket size = Total number of units sold / Total number of transactions
Why measure your basket size?
Basket size is a good metric to track if you’re a retailer that sells across multiple categories (e.g., supermarkets) or if you’re a store that carries products that complement each other or are frequently bought together.

A large basket size may indicate that your store is doing a good job at fulfilling shoppers’ needs. This is also a relevant KPI to track when running specific initiatives. If you’re hosting a multi-buy promotion, for example, then measuring your basket size makes a lot of sense.
How to improve your basket size
Increasing your basket size is all about encouraging shoppers to consider or purchase more items from your store. You can do this by:
- Upselling and cross-selling
- Implementing cross-merchandising in your retail displays
- Promoting impulse purchases.
6. Online sales relative to brick-and-mortar locations
This is a new metric that benefits omnichannel retailers — i.e., retailers that are selling online and offline.
To measure it, you need to look at your ecommerce analytics and see how much traffic or revenues are generated from locations where you have a brick-and-mortar presence.
For example, let’s say you just opened a new store in Austin, TX. You can measure the impact of your store on ecommerce by looking at web traffic and sales from users in relevant zip codes (i.e., zip codes in Austin and surrounding areas.)
Why measure the impact of physical retail on digital?
Consumers today are increasingly using multiple channels to shop, so you need to get a handle on how your physical presence influences your ecommerce sales. These days, crediting sales to a single channel isn’t enough, when people are interacting with your brand in many different ways and places.
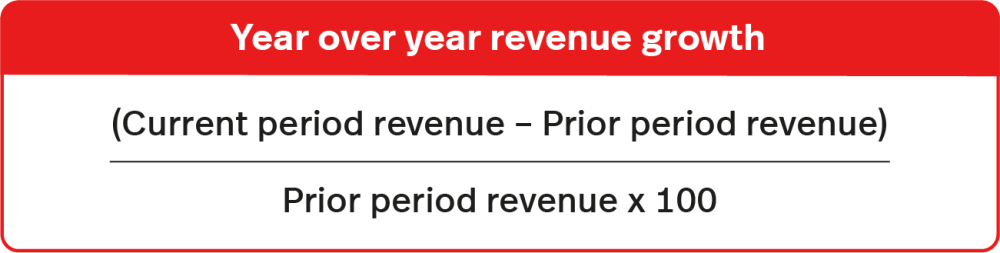
7. Year over year growth
Is your business growing? How better off are you compared to your previous years in business? To figure this out, calculate your year over year revenue growth with the following equation:
Why measure YOY growth?
Continuous improvement is a goal you want to strive for, and the best way to track your progress is to measure your current results against the previous period. This will help you track how your business is doing so you can react accordingly.
For example, if you find that you’re falling behind and your business isn’t performing as well as the previous year, then you can strive to change that.
How to improve your YOY growth
The first step to improving this is to figure out why you’re not growing at your ideal rate. If your growth has stalled, then drill down on the reason behind it. Is it the market? Are you failing to keep up with the latest trends? Is a competitor eating up market share?
Whatever the case, figure out the reason and then take the necessary steps to improve.
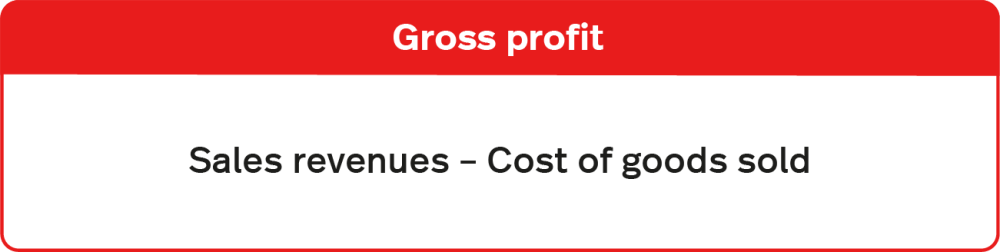
8-9. Gross and net profit
Your gross profit tells you how much you made after deducting the costs of creating and selling the product. Calculate it using the formula:
Your net profit tells you how much you made after deducting your cost of goods along with all other business expenses — including administrative costs, operating expenses, etc. To find it, use the equation:

Why measure gross and net profit?
Your gross and net profit will indicate whether or not you’re actually putting money in your pocket. Generating sales and revenue is good, but at the end of the day, you need to make money out of those sales.
Tracking these KPIs will help you make smarter decisions in various aspects of your business. For instance, if your gross profit is on the low side, then you may want to look into product sourcing and determine if there’s a way to lower your cost of goods.
How do you improve your gross and net profit?
You can try several profit-increasing strategies in your business. Here are some quick ideas:
- Streamline your operations to reduce expenses
- Raise your prices
- Increase your average order value
- Implement savvier purchasing practices
- Optimize your vendor relationships
- Limit markdowns and be more strategic with your promotions
Inventory metrics and KPIs
Getting your inventory levels “just right” is a tricky task, but it’s completely doable with the help of the metrics below.
10. Sell-through rate
Inventory sell-through rate measures the amount of inventory a retailer sells in relation to the amount they purchased from a manufacturer.
Retailers use it to estimate how quickly they can sell a product and convert their initial investment into revenue.
Retailers can calculate sell-through rates by product type, product category, brand or any other category they choose from their retail POS system.

Calculating the sell-through rate for any of these categories tells you whether or not investing in products (and what type of products, if you want to get that specific) from that manufacturer yields a fast ROI.
A high sell-through rate indicates that a retailer sold the inventory quickly in a given time period. Moving inventory fast and at full markup keeps gross profit margins as high as possible.
A low sell-through rate is an indication that a retailer isn’t selling those products as quickly as they expected. Inventory that doesn’t sell fast risks needing to be discounted, which impacts profit margins and lowers your ROI.
How to calculate sell-through rate
Sell through rate is calculated by dividing the number of units sold by the number of units received, then multiplying the sum by 100.
Most retailers calculate sell-through every 30 days. After 180 days of sitting on shelves or in the stockroom, that product is considered dusty inventory and should be discounted and sold to make room for new, seasonally relevant products that can be sold at full price without a discount.
Let’s say an apparel retailer buys 100 units of a specific brand of sweater. Within a month, the retailer sells 75 units. To calculate that sweater’s sell-through rate, the retailer does the following:
Sell-through rate = 0.75 x 100
Sell-through rate = 75%
Why measure sell-through?
Sell through is a great way to evaluate merchandise performance. It also helps you figure out the speed at which a product is selling so you can make the right purchasing decisions.
For example, let’s say you’ve stocked up on a new style of shoes and saw that you’ve sold through 80% of your inventory in just a week — which is unusually fast for your shop. You can use that insight to figure out how much to order so you don’t run out prematurely.
How to improve sell-through
The steps required to strengthen sell-through depends on your situation. A high sell-through rate could mean that you need to stock up on merchandise (unless of course, you’re deliberately trying to sell out of the item).
On the other hand, a slow sell-through rate means the item isn’t moving fast enough, and you need to figure out how to sell more. Should you run a promotion? Mark it down? Again, the right answer depends on your store’s situation.
11. Inventory turnover
Inventory turnover indicates the rate at which merchandise flows in and out of your store or webshop. It demonstrates how efficiently you’re meeting customer demand and securing a healthy ROI.
A good inventory turnover comes from effective stock control, as well effective marketing and pricing of your products. To calculate inventory turnover we need two additional formulae:
Average Inventory – Beginning Inventory + Ending Inventory / 2
Let’s say you’d like to calculate your inventory turnover for the first quarter of the year. First, you’d start with COGS.
At the beginning of the quarter, your inventory was worth £15,000. During the course of that quarter the value of your purchased inventory was £60,000. At the end of the quarter your inventory was worth £17,000. To get your COGs to the following formula:
COGs = (£15,000 + £60,000) – £17,000
COGs = £58,000
Now to calculate your average inventory, add your beginning inventory to your ending inventory and divide by two:
Average Inventory = £15,000 + £17000 / 2
Average Inventory = £23,500
Now we have these two figures, we can calculate inventory turnover by dividing them.
Inventory Turnover = £58,000/£23,500 = 2.4
Inventory Turnover = 2.4
On the other hand, if your inventory turnover is too high, it may mean that you’re buying inventory too often in small quantities. This could fail to meet customer demand and negatively affects sales. When it comes to inventory turnover, you should find a balance between meeting customer demand and maintaining a healthy ROI.
Why measure inventory turnover?
Inventory turnover is a critical metric for determining your optimal inventory levels. If your stock turn is too low, then it means you’re not selling out of inventory fast enough, and you risk carrying slow or dead stock.
However, if your inventory turnover is too fast (i.e., you’re selling out of the product four or more times a year), then it could mean that you’re not stocking up enough, and customers are continually dealing with out of stocks.

Retailers should be aiming for an inventory turnover of between 2 and 4. Any lower than that, and it’s an indication that your products aren’t selling at the rate you’d expect them to, either because you’re failing to forecast demand and buying too much stock or that you’re not investing enough in staffing or marketing to get customers to buy.
On the other hand, if your inventory turnover is too high, it may mean that you’re buying inventory too often in small quantities. This could fail to meet customer demand and negatively affects sales. When it comes to inventory turnover, you should find a balance between meeting customer demand and maintaining a healthy ROI.
How to improve inventory turnover?
It all depends. If your inventory turnover is too low, you need to be leaner with your merchandise and avoid over-ordering products. You should also make it a goal to move your slow-moving or dead merchandise ASAP.
Dealing with high inventory turnover? Optimize your stock ordering procedures to ensure that you’re not running out of inventory too frequently.
12. GMROI
Gross Margin Return on Investment (GMROI) measures your profit return on the funds invested in stock. It answers the question, “For every dollar invested in inventory, how many dollars did I get back?”
The formula for GMROI is:
GMROI = gross profit / average inventory
Why measure GMROI?
GMROI tells you how much money your inventory has made. You use this metric to figure out if your stock is turning a profit. It’s typically measured for specific products or categories because it can give you a good idea of which types of merchandise are worth carrying in your shop.

How to improve your GMROI
To increase your GMROI, ask yourself, how can I get more money out of my merchandise? Accomplishing that can mean:
- Increasing your prices
- Lowering your cost of goods
- Improving profit margins
- Improving inventory turnover
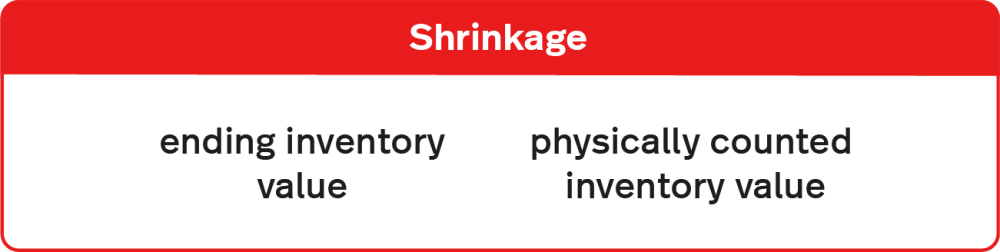
13. Shrinkage
Shrinkage is inventory loss that isn’t caused by actual sales. The common causes of shrinkage are employee theft, shoplifting, administrative errors, and supplier fraud. To calculate it, use the formula:
Shrinkage = ending inventory value – physically counted inventory value
Why measure shrinkage?
The last thing you want is to lose product or money to things like theft or admin errors. Tracking shrinkage keeps you vigilant and helps ensure that nothing shady is going on in your business.
How to reduce shrinkage
The right way to deal with shrinkage depends on what’s causing it. If it’s consumer theft, then you need to work on beefing up store security. Dealing with employee theft? Work on hiring the people and setting up procedures to prevent inside jobs from happening. Tightening up your processes also works for admin errors and vendor fraud.
Customers
In this section, we discuss some of the top customer-centric metrics to look at:
14. Foot traffic
This one is pretty straightforward. Foot traffic refers to the number of people who walk into your store. You can measure it using people counters and retail analytics software.
Why measure foot traffic?
Foot traffic helps you evaluate your marketing and advertising efforts. For example, if you recently launched a promotion to drive people to your shop, then looking at your foot traffic can tell you whether or not your campaign was successful.
This is also a significant metric for evaluating the success of your window displays.
How to improve foot traffic
There are various ways to drive traffic to your brick and mortar store. Some of our favorites include:
- Increasing your curb appeal
- Leveraging digital tools such as click and collect, online business listings, Google’s Local Inventory Ads, etc.
- Holding events
- Driving traffic from existing customers
15. Customer retention rate
Customer retention is the act of keeping individuals as customers who repeatedly purchase from you after they convert the first time.
You don’t want every customer out there to discover your product, think it’s great and only purchase it once. You want repeat customers who come back again and again, and who love your brand so much that they’ll sing your praises to their friends and peers, too.
You want your retention rate to be as high as possible. This not only ensures maximum profitability, but also lets you know that your marketing is sound, the quality of your product or service is strong and that you’re targeting the right people with your communications.
How to calculate customer retention rate
When calculating customer retention rate, you’ll need the following information:
- The number of customers at the start of a period (S)
- The number of customers at the end of a period (E)
- The number of new customers acquired over the same period (N)
With that information ready, use the following formula to find your retention rate:
Let’s say your average customer makes a purchase at least three times per year. You decide to use a year as your standard length of time.
At the end of a year, you saw that you had a total of 400 customers, and that 200 of them were new users. You started the year with 310 customers.
That equation would look like this:
Customer retention rate = (200 / 310) x 100
Customer retention rate = 0.64 x 100
Customer retention rate = 64.5%
For that year, your business had a 64.5% customer retention rate. Not bad!
Why measure customer retention?
Your customer retention rate tells you the amount of customers that return to your store. This metric is an excellent gauge for customer service, product performance, and loyalty.
How to improve customer retention
Getting people to come back boils down to how well you manage your customer relationships. Doing that can mean various things including:
- Tracking customer purchases and offering personalized recommendations
- Developing meaningful relationships through amazing customer service as well as community-building efforts like classes, events, or online groups
- Implementing a killer customer loyalty program to encourage shoppers to keep coming back
How to decide which KPIs to consider
So, which of the above KPIs should you measure? To figure this out, consider which metrics are relevant to your business.
A KPI like year over year growth, for example, is a good thing to track if you’re an established business, but it isn’t relevant if you’re a brand new retailer. Meanwhile, the metric sales per employee is good if you have a large team, but it won’t apply to your business if you’re the only one manning the store.
Another thing to consider is your focus and priorities. Your key performance indicators may shift depending on your current business objectives or the challenges that you’re facing.
Let’s say you’re currently dealing with issues around inventory discrepancies. If this is the case, then shrink would be a good metric to track. Or maybe you’re looking to motivate your team to perform better. If this is your goal, then sales per employee is something to monitor more closely.
The point is, the right KPIs in retail will vary depending on your business. One retailer’s key metrics aren’t the same for others, so examine your practices, priorities, and goals, then decide on your KPIs from there.
Whatever the case, figure out who to efficiently measure these on a regular basis. Formulas are useful, but you’ll save time by automating data and metric-tracking in your business.
Invest in a retail solution with robust reporting and analytics capabilities, so you can focus less on manual calculations and get straight to the insights you need.
Next is to take action. It’s not enough to know your metrics; you need to do something with your data. Use the info that you gain to identify areas for improvement, and then take the necessary steps to level up your game.
Get the tools to measure success.
Keeping tabs on the many aspects of business performance is important for running a profitable business.
Now more than ever, having access to business data can help you drive your business forward into the future. Want to know how Lightspeed can help? Let’s talk.

News you care about. Tips you can use.
Everything your business needs to grow, delivered straight to your inbox.